 PCM vs DSD«Education«Home
PCM vs DSD
I was at a Hannover tradeshow, perusing a Phillips Electronics brochure, curiously titled “SACD – Why do we need it?” The event was the Tonemeistertagung, and the brochure was a message to the consumer explaining why SACD is better than CD or DVD-Audio. While this particular booklet was quite benign in its assertions, there was one particular page that caught my attention. On the page was a depiction of a 10kHz square wave and two other pictures, one a graph of the square wave processed by PCM, and the other processed by DSD. The graphic showed that a 10kHz square wave, when passed through a DSD analog-to-digital-to-analog chain, looks much more like the original square wave than the same signal passed through a PCM A-D-A process. In fact, the PCM signal came out looking like a 10kHz sine wave! Was this right?
I was curious about two things. The output of the PCM converter seemed way too sinusoidal, especially to someone like myself who has been involved with high-resolution digital audio for so long. I knew that at lower sampling rates a 10kHz square wave would look pretty shabby, but the sine wave aroused some suspicions. This particular page was, after all, designed to show that SACD sounds better than DVD-Audio. The other thing that raised my eyebrow was the cleanliness of the DSD graph. It looked nearly identical to the square wave – not nearly shabby enough, I thought.
When I got back home, I thought I’d try out the comparison first hand, just to check Phillips’ homework. The following illustrations are well-known to some, and the ensuing analysis has been discussed at great length by those more entwined in digital audio processing than myself. I simply found the assertions in the brochure to be quite bold, and worth looking over. I used an analog 10kHz square wave generator, a dCS A/D converter, a dCS D/A converter, a good old-fashioned analog oscilloscope, and a digital camera. I ran the signal through directly to the scope (Fig. 1), then through the converters using 44.1kHz PCM, 96kHz PCM, 192kHz PCM, and finally, DSD.
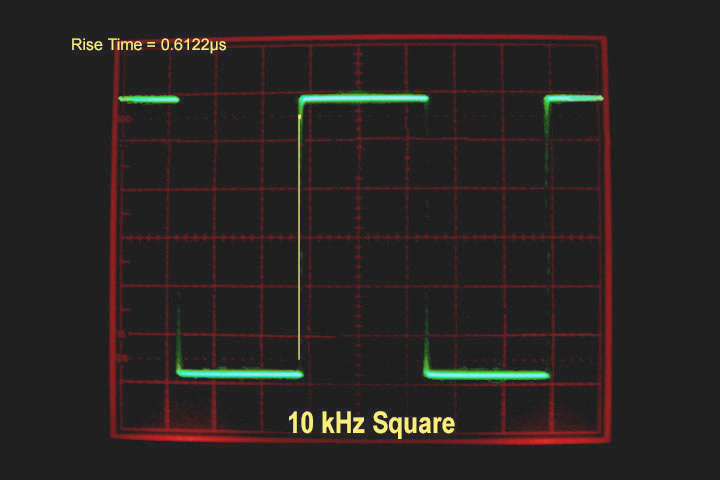
Figure 1 10kHz square wave, undigitized
Sure enough, the first PCM pass output a sine wave (Fig.2). This is not too surprising, considering that at 10kHz, a CD takes only 4.4 samples per cycle. Filtering and interpolation smooth out what would otherwise be a rather jagged signal. Note the smoothness of the trace on the scope. But since the pamphlet mentioned DVD-Audio, I proceeded with higher sampling rates.
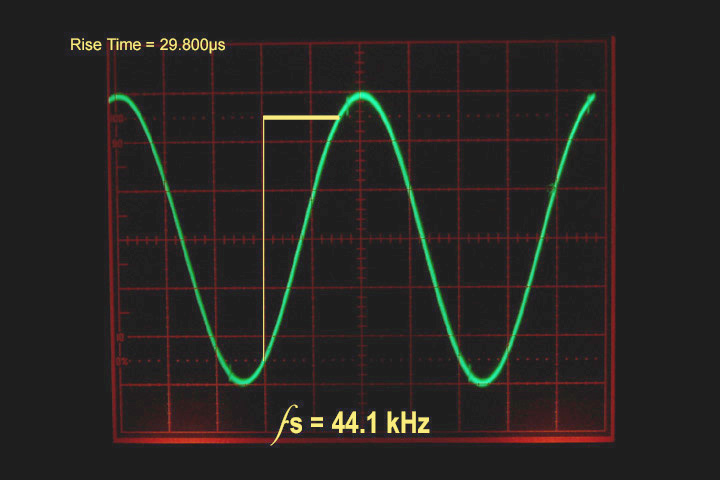
Figure 2 10kHz square wave sampled at 44.1kHz PCM
The 96kHz trace (Fig. 3) improved in two ways: the rise time of the tone improved greatly, which resulted in a sustained peak duration. This was beginning to look like a square wave. In fact, this picture begins to reveal more about square waves than most people care to know. Square waves are produced by adding a single sine wave to its odd harmonics (¥ +2¥ + 4¥ +…). That downward bump at the peak’s extremities is the first harmonic coming out of the signal.

Figure 3 10kHz square wave sampled at 96kHz PCM
At 192kHz (Fig. 4), the trace improves even more, halving again the rise time, and revealing the third harmonic of the square wave. The signal is still very crisp and consistent, and the difference in rise time between it and DSD are statistically (and perhaps audibly) insignificant.
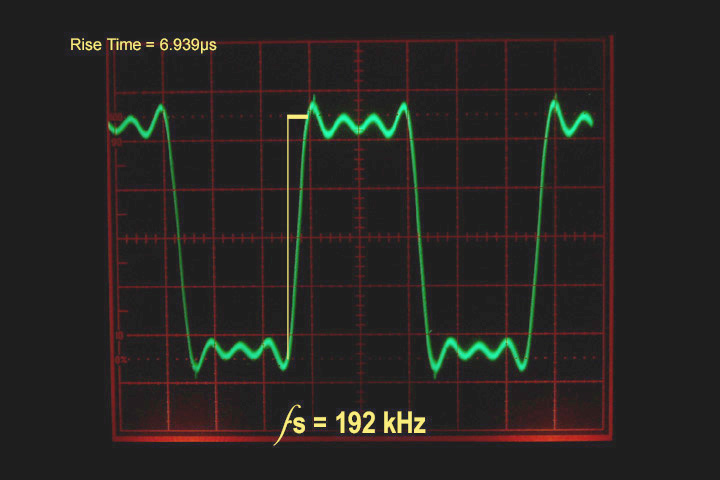
Figure 4 10kHz square wave sampled at 192kHz PCM
The DSD trace (Fig. 5) represents the square wave better than the first two PCM traces, and it does look very similar to the picture in the Phillips brochure (except that it’s blurry). Like the 192kHz photo, The DSD signal begins to extract the first and third harmonics from the square wave. But DSD’s accuracy comes with a cost, which is not discussed by proponents of SACD: loads of noise.
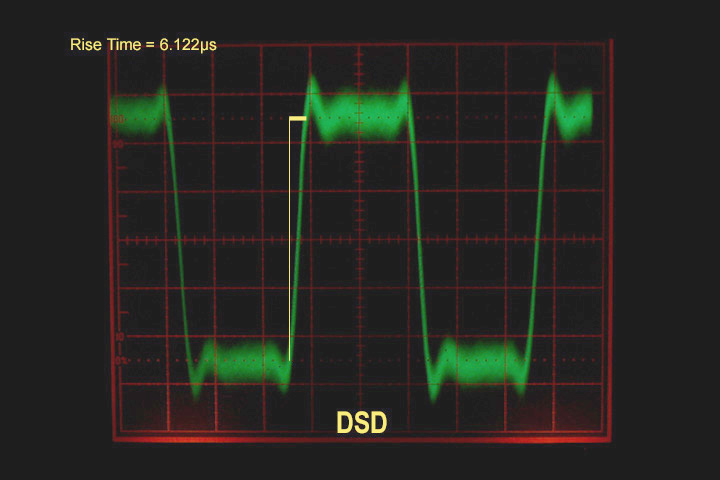
Figure 5 10kHz square wave sampled with DSD
The noise created by Direct Stream Digital is tremendous, so tremendous, in fact, that Sony/Phillips have created a noise-shaping system designed solely for the purpose of disguising the inherent noise in a DSD signal. Explained briefly, the noise created by DSD’s one-bit sampling is shifted out of the lower frequencies, and shoved up into the ultrasonic range, thereby making the noise “inaudible.” We can see that the system is not quite perfect, as the 10kHz signal is still tainted by noise. But this noise is not the only fly in the ointment.
The blurring in Figure 5 is caused by imprecise traces along the vertical and horizontal axes, which are much more significant than the noise superimposed on the traces themselves. These imperfections in the DSD signal are, respectively, amplitude imperfections and time domain imperfections. Were one to zoom in on the DSD signal, one would actually see amplitude fluctuations of 50% peak amplitude, and time domain errors similar to the 96kHz rise time deviation. The defect, when compared with the PCM photos, illustrates perfectly the reason that DSD is incapable of reproducing the same transient twice. Note again the precision with which PCM represents the signal. If DSD cannot identically represent a simple square wave over a very short period of time (as compared to the PCM models), the time domain errors caused by DSD sampling are too great to precisely and accurately (remember those terms from first year physics?) reproduce a sound.
What conclusions can be drawn from this photo gallery? Well, one must certainly point out that a 10kHz square wave does not make for a very memorable listening experience. However, it does help dispel the myth that DSD’s one-bit sampling is the panacea to the world of digital audio. We can clearly see that with this particular waveform, PCM produces a much more faithful copy of the original with both accuracy and precision.
Now, at the upper end of the audible spectrum, we toy with the age-old (and sometimes annoying) digital question: can humans really perceive sound above 22kHz? I am of the opinion that ultrasonic harmonics make a difference. Otherwise, I’d be working at 24-bit 44.1kHz, and not bothering to open this discussion. The significance of the preceding graphs is certainly in the ultrasonic. Remember the noise-shaping issue with DSD? Well, the noise in a DSD signal increases dramatically as the frequency increases. In fact, DSD’s noise level can be up to –40dB in the ultrasonic range1. 24-bit PCM has a consistent noise level of –144dB across all frequencies. This means that DSD’s ultrasonic characteristics are tainted with noise as the listening frequency goes up. How can warmth and harmonics be reproduced in such a maelstrom? It’s like listening to an ultrasonic cassette. This is, by the way, why most SACD players are made with a built-in 50kHz rolloff filter. Though Sony and Phillips tout a 100kHz frequency range, the spectrum must be halved at the player’s output. Since such a barrage of ultrasonic energy tends to fry tweeters, the rolloff is necessary to protect equipment incapable of handling this sonic assault. So much for the efficiency of one-bit systems.
My most significant conclusion points simply to more questions: How does an engineer work with DSD? Do you roll the room off at 50kHz or leave it at 100k? Where is the peace of mind that your work will be accurately reproduced once it leaves your studio? SACD – Why do we need it?
1Ingvar Öhman, interviewed by Niklas Ladberg, Elliott Sound Products